User Groups Learning Tabular Documentation Important Miscellaneous DAX and Tabular Model Dev Resources
Dataflows Best Practices Bloggers/YouTubers Performance Custom Visuals External Tools Artificial Intelligence Report v. Dashboard
PBI v. SSRS Visio Visualizer
| Fall 2020 Logo | Previous Logo |

Metaphor: the “wave” is the Power BI development team and the boat is any competitor of Power BI.
Remember, when Microsoft is “in it”, they’re in it to win it!
User Group Information
To find events and find user groups
To post questions, find gallery items and more…

List of some of the active USA and foreign Power BI user groups, such as 
Check out Mark Walter’s blog (Story BI) post, “Links to some of the best Power BI resources the web has to offer” which lists mosts of the “must-know” Power BI resources. Our resource lists overlap a great deal.
Power BI Learning options
- Microsoft Learn content for Power BI – many “Learning Path” modules available, some on the way to certification. Find the right Power BI training path for you. See the “Power BI Certifications” section below.
- Microsoft Dashboard in a Day (DIAD) – the content is excellent. Go through the self-paced content two or three times…literally!
- Special course from Microsoft: Data Modeling & Shaping. But the real point is that you can download the assets of this advanced training and use them as self-paced resources
- (Microsoft) Webinar Series: Mastering Data Modeling with Power BI (multiple “episodes”, also referenced below in the “Regarding Data Modeling” section)
- Don’t forget to view the learning resources on my Tabular Model development resources page
- Virtual Workshops & Training from Microsoft, such as: Get Started with Power BI (14 sessions)
- There are lots of additional learning resources found on my Tabular Data Model Developer page, including free, self-paced video courses, and more
- See links to a couple of other gifted bloggers and YouTubers below. Some have paid courses as well.
- Chandeep Chhabra Blog YouTube channel
- Bas Dohman YouTube channel
- Nikola Ilic Videos Courses
- Microsoft Power BI Community – Webinars and Video Gallery
- There’s a lot of overlap in the resources listed by Arno Wakfer in his “Power BI Learning Resource Guide” but I wanted to list it
(Videos – Blogs – Courses – Books – Tools – Datasets) - Take a live paid course from a training provider like Pragmatic Works or New Horizons
Power BI Certifications
See above in the “Learning options” section
- The PL-300 exam: Microsoft Power BI Data Analyst replaces the DA-100 exam (late February 2022), which replaced the 70-778 exam
- Look for the “Skills Measured” section and download the outline
- Check out this awesome study guide for PL-300 put together by Lukas Halim
- Study material for exam PL-300 Analyzing Data with Microsoft Power BI by Sean Lee at MSSQLTips {tons of reference links. Originally this resource was created for the DA-100 exam but was revised for PL-300}
- Exam DP-500: Designing and Implementing Enterprise-Scale Analytics Solutions Using Microsoft Azure and Microsoft Power BI (beta)
- Nikola Ilic (Data Mozart) has put together some awesome preparatory blog posts for the DP-500 exam
- Resources to prepare for the Exam DP-500: Designing and Implementing Enterprise-Scale Analytics Solutions Using Microsoft Azure and Microsoft Power BI by Nuric Ugarte
| Power BI Certification Prep Books | |
 | Exam Ref PL-300 Microsoft Power BI Data Analyst By Daniil Maslyuk Microsoft Press Store by Pearson |
 | Microsoft Power BI Data Analyst Certification Guide by Orrin Edenfield , Edward Corcoran Packt Publishing |
My PBI bookmark file, as of July 2019, with about 400 of my *favorite* PBI links. Import this into your browser
Tabular Data Model Developer – Tools & References
Tabular Data Model Developer – Tools & References
Power BI is an Enigma, so What to Do?
(a blog post from Matt Allington) 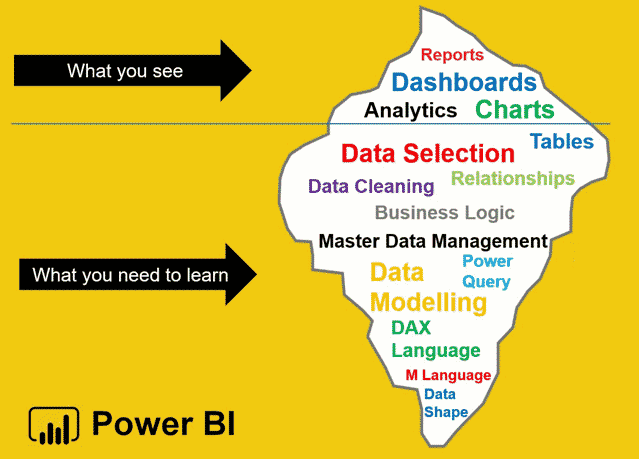
I also love this diagram/metaphor also (but I don’t know who to credit) 
A few select Power BI Documentation references:
- What is Power BI?
- Power BI certification
- Dashboards
- Dashboards in Power BI service, including Dashboards v. Reports
- Share Power BI dashboards and reports with coworkers and others
- Tips for designing a great Power BI dashboard
- Create report templates for Power BI Desktop
- Licensing
- Power BI service features by license type
- Check out Gilbert Quevauvilliers’ “Power BI Free vs Pro” infographic
- What is Microsoft Power BI Premium?
- Power BI service features by license type
- What is Power BI Report Server?
- Data
- Best practices when working with Power Query (see other “Best Practices” references below)
- Power Query M Function Reference
- Row-Level Security (RLS)
- Generate data insights automatically with Power BI (Quick Insights, part of the Power BI Service)
- Visualizations
- Get samples for Power BI
- Visualizations in Power BI reports – documentation on each of the built-in visualizations
- Create tooltips based on report pages in Power BI Desktop
- Create a QR code for a report in Power BI to use in the mobile apps
- Drill mode in a visual in Power BI
- Run Python Scripts in Power BI Desktop
- Run R Scripts in Power BI Desktop
Other Important Power BI References
- Regarding Accounts and Administration ===================
- To set up your own Power BI account in your tenant (five second setup IF your tenant already exists, AND your Power BI administrator enables self-enrollment)
- Power BI Workspace Permissions and Roles by Scott Murray at MSSQLTips
- Regarding Visuals, Report and Dashboard Design ==============
- Welcome to the Data Stories Gallery
- Power BI Custom Visuals Gallery
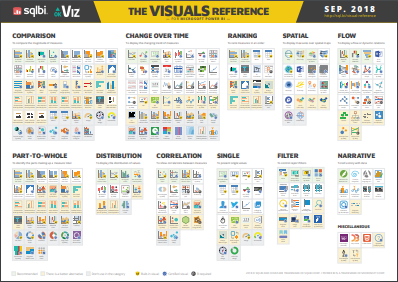
- The Visuals Reference from SQLBI
- Devin Knight’s Power BI Custom Visuals (video) blog, over 110 short videos
- Dynamic hierarchies in Power BI
- Charticulator, a Microsoft research project for creating Power BI custom visualizations
- A few resource links from Miko Yuk and her team at BIBrainz
- Dashboard examples
- Blog, with links to other resources like “Analytics Design Guide” and “5 Reasons You Suck at BI Dashboard Design” and “Top 5 Websites to Bookmark to be a Better Big Data Visualization Expert“
- DIY Freebies to Ignite your Data Storytelling journey! (books, whitepapers, etc.)
- SVG in Power BI – Part 3 – Fill up with Colour by Laura GB at Hat Full of Data
- The Complete Interactive Power BI Visualization Guide from Iteration Insights by Claire Mikalauskas. See an example of every built-in visual.
- Resources about Map visuals in Power BI
- 10 Ways to Create Maps in Microsoft Power BI by David Eldersveld at DataVeld
- Power BI Bubble Map, Shape Map and Filled Map Examples by Gauri Mahajan at MSSQLTips
- Power BI with Maps: Choose Your Destination by Rayis Imayev at SQLServercentral
- ArcGIS Maps for Power BI: Free vs. Paid version by Rayis Imayev at SQLServercentral
- Creating Custom Maps to Display Data with Power BI (features the Shape Map visual) by Nat Sundar at MSSQLTips
- Deep dive into the ESRI Map Visual in Power BI by Arthur Haddad
- How to Import GeoJSON Shapes into Map? (6:35 YouTube by Dhruvin Shah
- Power BI, Maps, and Publish to Web by Meagan Longoria at DataSavvy
- 10 Ways to Create Maps in Microsoft Power BI by David Eldersveld at DataVeld
- Regarding Data Modeling ==================
(I have a page dedicated to Power BI Relationships)- Understand star schema and the importance for Power BI (Microsoft docs, excellent article)Power BI and a Star Schema by James Serra at SQLServerCentral
- Here’s another explanation of why your data model should have a star schema by Patrick LeBlanc of Guy In a Cube
- Understand star schema and the importance for Power BI (Microsoft docs, excellent article)Power BI and a Star Schema by James Serra at SQLServerCentral
- Star Schema in One Slide (nice visual from Brian Julius)
- Microsoft Power BI: The Do’s and Don’ts of Power BI Relationships – BRK3019 YouTube by Pete Myers (~60 min.)
- Create custom keys for your Power BI relationships, YouTube video (~10 min.) by Patrick LeBlanc at GuyInACube on turning a flat table into a star schema
- (I like this one too, regarding Many-to-Many relationships, an Excel example by Ken Puls)
Solve Many to Many Joins Using Bridge Tables – Monkey Shorts Episode 038, 3:29 YouTube
- (I like this one too, regarding Many-to-Many relationships, an Excel example by Ken Puls)
- Create custom keys for your Power BI relationships, YouTube video (~10 min.) by Patrick LeBlanc at GuyInACube on turning a flat table into a star schema
- Webinar Series: Mastering Data Modeling with Power BI with
Marc Lelijveld (Data & Analytics Consultant, Macaw Netherlands) and Jeroen ter Heerdt (Senior Program Manager at Microsoft)- Episode 1 – Data Modeling 101: Increasing the Impact of Power BIEpisode 2 – Learn Advanced Data Modeling with Power BIEpisode 3 – Data Modeling for Experts with Power BI
- Episode 1 – Data Modeling 101: Increasing the Impact of Power BIEpisode 2 – Learn Advanced Data Modeling with Power BIEpisode 3 – Data Modeling for Experts with Power BI
- Webinar Series: Mastering Data Modeling with Power BI with
- Data modelling 101 with Power BI | Community Webinars, 1:10:16 YouTube by Reza Rad
- Data modelling 101 with Power BI | Community Webinars, 1:10:16 YouTube by Reza Rad
- Separate Reports from Models in Power BI Desktop from the Power BI docs (decouple / decoupling / Golden dataset)
- Separate Reports from Models in Power BI Desktop from the Power BI docs (decouple / decoupling / Golden dataset)
- Splitting a Power BI (PBIX) File into a Dataset and Lean Report File (4:10 YouTube by Reid Havens)
- Splitting a Power BI (PBIX) File into a Dataset and Lean Report File (4:10 YouTube by Reid Havens)
- Execute SQL Server Stored Procedure With User Parameter In Power BI by Dhruvin ShahPassing parameters to SQL stored procedures in Power BI Desktop by WiseOwl Training
- Understanding Cross Filter Direction with a simple example by Dinesh Priyankara
- Different Types of Many to Many Relationships in Power BI – video by Marco Russo presented at SQLBITS
- DAX 101: Automatic time intelligence in Power BI by Alberto Ferrari at SQLBI {don’t use the built in date table(s)}
- {similar to above} Power BI Model Size Bloat And Auto Date/Time Tables by Chris Webb at his Crossjoin blog
- {similar to above} Power BI Model Size Bloat And Auto Date/Time Tables by Chris Webb at his Crossjoin blog
- Naming Tables, Columns And Measures In Power BI also by Chris Webb {read the comments, too}
Add Descriptions for Everything You Create in Power BI by Marc Lelijveld at Data – Marc- Chris Wagner’s resources on his “Data God Model” on Kratos BI
- Regarding Data Transformation and the Power Query Editor ===============
- General tip: Always accept pain as early in the development process as possible. I first heard this from Dave Rodabaugh of Atlas Analytics at a SQLSaturday in Columbus. A modern version of this was called “Roche’s Maxim” as described by Stuart Box at BurningSuit
- Doing Power BI the Right Way: 2. Preparing, shaping & transforming source data, a.k.a. “Where should I shape and transform data?” by Paul Turley
- Exporting Your Queries’ M Code From Power Query And Power BI Using Copy/Paste by Chris Webb
- Extracting All The M Code From A Power BI Dataset Using The DISCOVER_M_EXPRESSIONS DMV also by Chris Webb
- 6 ways to go bananas with Column from Examples in Power BI from GuyInACube, a YouTube video
- Split the Date Using Power Query or Get & Transform by Bryan Hong at MyExcelOnline
- Query Parameters
- Great four-part series on Query Parameters from Soheil Bahkshi at bi insight complete with use-cases
- Deep Dive into Query Parameters and Power BI Templates by Miguel Llopis at the Microsoft Power BI Blog
- Power Query Parameters Vs. What If Parameters: Power BI Implementation Use Cases
- The main benefit of Parameters in Power BI / Power Query by Miguel Escobar at Powered Solutions
- Split the Date Using Power Query or Get & Transform by Bryan at MyExcelOnline
- Split the Time Using Power Query or Get & Transform by Bryan at MyExcelOnline
- Many Part Series on Power Query/M by Ben Gribaudo
- Adding an Error Details Column by Ben Gribaudo
- Comparing M Code Between Files by Ben Gribaudo {requires PowerShell and DIFF tool such as with Git)
- Power BI Data Profiling – distinct vs unique by Vitalie Ciobanu
- General tip: Always accept pain as early in the development process as possible. I first heard this from Dave Rodabaugh of Atlas Analytics at a SQLSaturday in Columbus. A modern version of this was called “Roche’s Maxim” as described by Stuart Box at BurningSuit
- Regarding Data Refresh =======================
- DirectQuery, Live Connection or Import Data? Tough Decision! by Reza Rad at RADACAD
- The Power BI Gateway; All You Need to Know by Reza Rad
- Power BI Gateway installation screenshots (this website, a little old now)
- Regarding Themes {must have references if doing theme work} ================
- Use report themes in Power BI Desktop (Power BI docs, lengthy, detailed, excellent)
- Power BI Theme Templates (GitHub)
- Theming for Filters pane (Power BI docs)
- How To Discover Undocumented Theme Settings in Power BI Desktop from NoLock
- Data Color Reference for Power BI Themes (as of December 2019) by David Eldersveld
- Power BI – Custom Report Theme by Joseph Yeates at Feathers Analytics
- Power BI Layouts and Themes by Scott Murray at MSSQLTips
- JSON Formatter (useful if you need to read unformatted JSON)
- Use report themes in Power BI Desktop (Power BI docs, lengthy, detailed, excellent)
Dataflow – Video links and references
- What are the Use Cases of Dataflow for You in Power BI by Reza Rad, 9:37
- Dataflows vs. Datasets by Matthew Roche
- Power BI Dataflows 201 – Beyond The Basics by Matthew Roche, 1:00:11
- Getting Started With Dataflow in Power BI Creating Dataflow – Part 2 of Dataflow Series by Reza Rad
Third-Party Power BI Connectors from CData (quite an extensive list) $$$
Best Practices, Cheat Sheets, & Tips & Tricks
Did I miss any good posts? Also, see the references in my “Documentation” section above. Yep, there’s a lot of overlap among these but they each have their “angle” and there’s no harm in repetition here.
- Check out the many “Power BI Guidance” documentation references at Microsoft Learn
- Best practices when working with Power Query (referenced above, Power BI documentation)
- Power BI Best Practices by Matt Allington at Excelerator BI
- The Very Basics of Great Power BI Report Design by Brian Grant at CSG Pro
- Power BI Bookmarks Tips, Tricks, and Best Practices by Steve Campbell at PowerBI.Tips
- Best practices when working with Power Query {Power BI documentation}
- Top 10 Power BI mistakes and their best practice solutions by Michael Kovalsky at ElegantBI
- Best practice rules to improve your model’s performance from Michael Kovalsky at the Power BI Blog
- Power BI Best Practices by Koen Verbeeck at MSSQLTips
- Data model guidelines and best practice” from the Zebra BI Knowledge Base
- (and sort of the opposite) Power BI Dashboard Design: Avoid These 7 Common Mistakes by Ziga Milek at Zebra BI
- Data Import Best Practices in Power BI by Marco Russo at SQLBI
- Best Practices Using SUMMARIZE and ADDCOLUMNS by Marco Russo at SQLBI
- All the Secrets of SUMMARIZE by Alberto Ferrari at SQLBI
- DAX Best Practices Guide by MAQ Software
- 23 Best Practices for Power BI, Part 1, from MAQ Software
- 23 Best Practices for Power BI, Part 2, from MAQ Software
- Power BI – Report performance best practices by Mara Pereira at Data Pears
- My Top 5 Power BI Visual Design Practices: Transforming Good to GREAT by Reid Havens when he was at P3 Adaptive (formerly Power Pivot Pro)
- A New Episode Of The Series Bad Practices In Power BI – a rant by Gil Raviv at Datachant
- Top 10 BI best practices by Mikkel Oldenburg at Targit
- Best practices in Power BI report design (an 11 page ebook by DevScope)
- Numbers Shouldn’t Lie – An Overview of Common Data Visualization Mistakes by Micah Bowers at Toptal
- 8 Mistakes I made to Start Learning Power BI by Steve Campbell at PowerBI.Tips
- Present your back side: 7 ways to tone your Power BI booty by Versor (AU)
- Every Successful Power BI Adoption Strategy Has These 4 Elements by Collectiv
- Our TTOP tips for Power BI report design by Matthew Spuffard at Base One
- Doing Power BI the Right Way: 2. Preparing, Shaping & Transforming Source Data by Paul Turley (also talks about Query Folding)
- Macaw Power BI Cheat Sheet by David Ruijter and Marc Lelijveld
- Giving Back: “Steal” this Reference Card! – 8 page reference card (mostly DAX and data modeling) available from P3 Adapative (formerly PowerPivotPro)
- Several cheat sheets available from Štěpán Rešl at DataBrothers
- Data Visualization Cheat Sheets by Hubert Baniecki at Medium
- Power Query (M Language) cheat sheet by Ivan Bondarenko
- Five Golden Rules for Cleaning Data in Power BI by Swaathi Sundaramurugan at Medium
- DAX Date Calculations Cheat Sheet by Arthur Graus
- Whitepaper: 7 Steps to Better Power BI Visuals by Meagan Longoria at Blue Granite
- Several downloads available from Chandeep Chhabra at his site, Goodly
- Download Power Query Tip Card (no direct download link)
- DAX and Data Modeling Tip Cards (no direct download link)
- Pick up the Right Chart – Guide
- Deneb Cheat (and Vega-Lite) Sheet from Enterprise DNA (must have at least a free account)
- Understand Join Types in Power Query by GorillaBI (Rick de Groot) and cheatsheet
- Good Practices and Due Diligence for Lazy Power BI Developers by Robert Stewart (LinkedIn post)
- Power BI Warning Signs by Brett Powell at Insight Quest (sort of the opposite of best practices)
- Four part series from DataMartin – Essential Checklist to Keep Your Power BI Solutions Optimized (Thank you, Nuric Ugarte for the suggestion to add these, and her suggestion to add this one posted by Sam Mackay from EnterpriseDNA (containing other embedded links), Data Modelling In Power BI: Helpful Tips & Best Practices)
- AI readiness and best practices for semantic models: a comprehensive guide by Ruben Van de Voorde at Tabular Editor
Miscellaneous Power BI links and resources
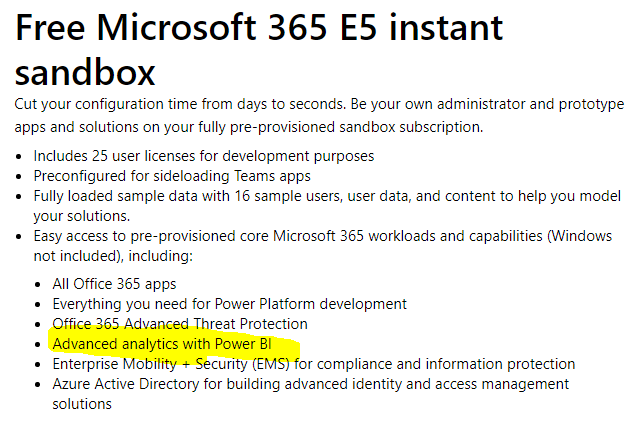
- Get a free Microsoft 365 E5 developer subscription
- How to Easily Map Your Database Schema in Power BI by BI Elite (9:48 YouTube, so clever) [primary key, foreign key]
- Uses two custom visuals (Network Visualization and Filter by ZoomCharts, and, the Chiclet Slicer by Microsoft)
- Does not immediately account for the situation where the PK & FK column names are different, but the YouTube comments may address this
- Power BI End-To-End {diagram}: Top Features, Key Integration Points & Related Services from Melissa Coates
- YouTube series by Jon Schwabish at PolicyViz called “One Chart at a Time“. Different presenters introduce a visual type and answer these three questions about it:
- Can you please describe the graph?
- Can you please describe any considerations chart makers need to take into account when creating this type of chart?
- Can you please share an example of this chart you really like?
- Financial Times Visual Vocabulary {SQL Jason – Analytics Blog} This is used to help all of us make better chart choices, modeled after a Tableau version
- Do I need Power BI Premium? by Marc Lelijveld at Data-Marc [infographic]
- Power BI Weekly by endjin.com (news about Power BI)
- “Rapid BI Solutions with Power BI and Power Query” presentation (on YouTube) to GLUGnet in December 2020 By George Squillace
- How to Create an Automated Data Dictionary by Michael Kovalsky at Elegant BI
- (follow-up post) Automated Data Dictionary – Reinvented
- (follow-up post) Automated Data Dictionary – Reinvented
- Assess Knowledge using the Power BI Skills Matrix (Power BI.tips). Gulp, I found this pretty challenging, even after all the time I’ve spent with PBI.
- Power BI Chart Flipper Ideas by Harprett Ghuman
- Power BI Map – The world’s most complete overview of Power BI blogs by BI-Survey.com
- What makes up a Power BI Desktop PBIX File (and how to view it’s content; it’s a .zip file) by Gilbert Quevauvilliers at Four Moo
- Same author, possibly a better version from his personal website
- Same author, possibly a better version from his personal website
- Data Model Cleaner for Power BI and Analysis Services (SSAS) by DataMartin (Nuric Ugarte, you wrote this, right?)
Keyboard Shortcuts in Power BI Desktop (I have keyboard shortcut references for many other things, too)
- Keyboard shortcuts in Power BI Desktop (product documentation)
- Checkout these awesome DAX editor keyboard shortcuts in Power BI Desktop! (Power BI Community)
- A more animated version of the above by Daniil Maslyuk at XXL BI
- A more animated version of the above by Daniil Maslyuk at XXL BI
- (While I’m at it…) Overview of accessibility in Power BI (Power BI docs, especially the “Design Power BI reports for accessibility” link)
- DataViz Palettes (tool to “quickly see what your color palette would look like on an actual graph”)
- A Detailed Guide to Colors in Data Vis Style Guides by Lisa Charlotte Muth at Datawrapper (also, scroll to the bottom of the lengthy, excellent resource for a large list of public style guides)
- Dealing with Incorrect Totals in Power BI, 14:43 YouTube by Chandeep Chhabra
Other Power BI and Data Bloggers / YouTubers to Follow
- Chandeep Chhabra (Goodly) Blog YouTube channel
- Bas Dohman YouTube channel
- Nikola Ilic Videos Courses
- Data Goblins by Kurt Buhler (great cartoons and caricature, too)
References on Performance
- Power BI Best Practices Guide by MAQ Software (they have other valuable best practice guides, too)
- Data Validation Best Practices Guide (also by MAQ Software)
- Power BI: Data Model Optimization by Data on Wheels (short, mostly talks about Date tables)
Artificial Intelligence (AI) Features in Power BI
Power BI Smart Narrative by Scott Murray at MSSQLTips
What is the difference between a Power BI Report and a Dashboard?
- Power BI Dashboard vs Report vs Workbook by Koen Verbeeck at MSSQLTips
- Dashboard vs Report; Differences At a Glance – Power BI by Reza Rad at RADACAD
- Power BI: Dashboards vs. Reports by the Power BI Team
- Power BI Dashboard vs. Report: The Pros and Cons by Kasper Langmann at Spreadsheeto
- Power BI Dashboard vs. Report at EduCBA
PASS BI virtual chapter from Ginger Grant, “Power BI Practical Storytelling and Visualization Techniques” (a report makeover)
Custom visuals that seem especially useful to those in finance and accounting:
- ZebraBI

- Check out “Top features of Zebra BI visuals for Power BI“
- Check out “Top features of Zebra BI visuals for Power BI“
- ValQ

- 3AG

- Dataviz Boutique – Klaus Birringer and the “Ultimate” series of PBI visuals

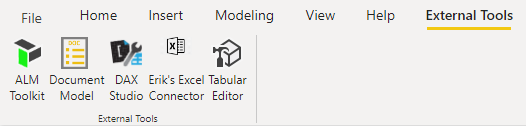
External Tools
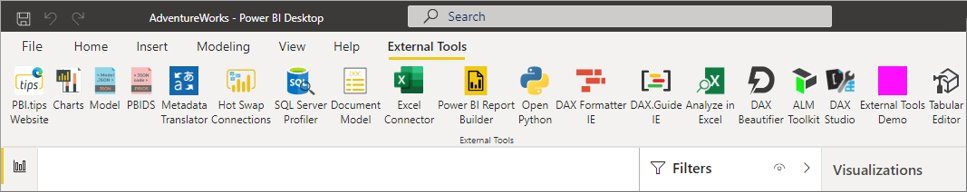
- External Tools in Power BI Desktop (Microsoft documentation)
- Power BI Desktop External Tools and Why You Should be Using Them by Kenneth Omorodion at MSSQLTips
- From PowerBI.Tips, BusinessOps – “One Tool to Install them All”
- Level Up Your External Tools Menu In Power BI by Brian Julius at EnterpriseDNA
- Power BI Sidetools, a free external tool by Didier Terrien from The BI Power (instructional video link, too)
- DAX Generator
- DAX Debugger
- DAX Parser
- Easily export data to Excel
- Transfer DAX and M formulas to files
- View your DAX and M formulas in Visual Studio Code
- Manage your external tools easily with Power BI Sidetools – Fabric Community blog post by Didier Terrien
- Report Analyzer by Michael Kovalsky at Elegant BI
- External Tools: Document your Power BI Model by Marc Lelijveld at Data – Marc
- Hot Swap Report Connections – External Tools by Steve Campbell at PowerBI.Tips
- Python as an “External Tool” in Power BI Desktop: Part 2 – Create a PBITool.json File by David Eldersveld at DataVeld
- Power BI Cleaner Gen2 from Imke Feldmann at The BIccountant
Power BI v. Reporting Services, a few references…
- Power BI vs SSRS – Choose the best tool for fulfilling your requirements! at Data Flair
- Differences Between Power BI vs SSRS at EduCBA
- SSRS vs. Power BI – when to use and why? at StackOverflow
Visio Data Visualizer
- Microsoft Visio Data Visualizer (download link)
- Visio Data Visualizer Tips from bVisual.net
- Video (~37:00) Create data-driven diagrams with Microsoft Excel and Visio by Amit Oberoi and Prateek Sharma
Screenshots: Using Power BI with WordPress and Google Analytics
In December 2020 I presented “Rapid BI Solutions with Power BI and Power Query” for GLUGnet. Thank you Sam Nasr and NIS Technologies for sponsoring and recording and editing the video.